
The average digital service enterprise is losing significant computing efficiency through un-optimized server allocation latency. Corporate technology teams spend massive capital provisioning excessive cloud instances, manually tracking memory usage spikes inside legacy infrastructure interfaces, and reviewing network bandwidth metrics days after an operational bottleneck has occurred. They monitor their performance metrics inside Google Search Console, observe early search traffic performance variations, and mistake this chaotic administrative drag for proactive systems governance. In 2026, as high-velocity multi-agent ecosystems scale and data payload requirements expand asynchronously, allowing an autonomous pipeline to execute heavy computations without a strict, real-time resource-throttling architecture is an infrastructure layout failure. Absolute technical sovereignty requires deploying an open-source Automated Metrics Code.
The core thesis of advanced infrastructure optimization is simple: server performance telemetry must not function as a historical record; it must operate as an active, event-driven resource-routing system. When you allow your decentralized sub-networks to execute continuous database mutations or handle multi-threaded scripts without an independent surveillance layer, you invite severe hardware drag into your execution core. If an autonomous node triggers an unbuffered memory leak, the host system state begins to slow down, leading to processing delays and failed webhooks. Shifting your host workspace to a verified Automated Metrics Code matrix permanently neutralizes this breakdown. We deploy secure event-driven monitoring nodes that capture runtime resource variables, evaluate threshold perimeters, and execute programmatic resource rebalancing sub-second without visual UI drag.

The Bandwidth Leak: Why Uncalibrated Hardware Scaling Punctures Your Systemic Alpha
To understand why your development and operational velocities collapse under intense analytical workloads, you must analyze the structural latency of un-throttled compute nodes. Relying on an agentic network to coordinate complex pipelines—such as managing data vectors inside an active Multi-Agent Governance core—without an independent verification loop is a critical design error. Unmonitored hardware consumption introduces high entropy into your back-office core, creating a fragmented environment where processing inefficiencies compound silently.
[Compute Resource Spike] ➔ [Thread Congestion Anomaly] ➔ [API 대역폭 Bottleneck] ➔ [Operational Velocity Collapse]
When an automated routing agent processes an anomaly inside an active Automated Logging Code engine, it requires immediate hardware allocation parameters. If your workspace introduces a heavy metadata string that goes un-throttled by a central monitor, the system stalls, trapping your processing nodes in an idle state of high operational latency. The deployment of an integrated Automated Metrics Code matrix permanently eliminates this vulnerability. By connecting your server-side telemetry sensors straight to autonomous workflow gateways, your system treats resource metrics as direct execution commands, triggering defensive cloud scaling scripts programmatically at the host kernel level.
Anatomy of the Metrics Core: The 10-Second Resource Allocation Matrix
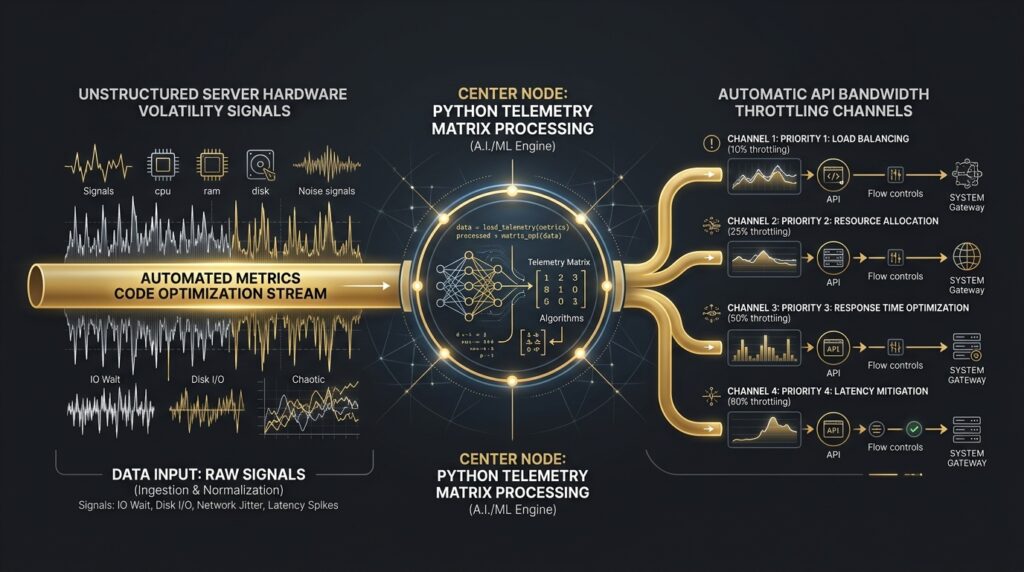
Let us deconstruct the programmatic framework of an active Automated Metrics Code infrastructure running silently on our private backend server infrastructure. By separating the primary Execution layer from the independent Surveillance layer, we protect The Agentic Core environment from hardware degradation and secure absolute computing continuity across all automated channels.
[Hardware Telemetry Ingestion] ➔ [Python Matrix Calculation] ➔ [n8n Condition Parsing] ➔ [Autonomous Bandwidth Rebalancing]
The Unmonitored Reality of Silent Infrastructure Decay
An autonomous multi-agent subnet executes a massive scraping block. The script triggers a severe memory consumption spike. Because it operates without continuous metrics logging, the compute node experiences a thread collision, hanging for hours and dropping transaction webhooks. Total human friction: 6 hours of manual server restarts and severe operational capacity paralysis.
The Sovereign Vector of the Optimized Automated Metrics Code
Our open-source repository eliminates this implementation drag through a decoupled, multi-tiered data synchronization sequence:
- The Telemetry Interception: The exact millisecond an active python node or n8n Multi-Agent Blueprint workflow logs a hardware state mutation, an encrypted webhook passes the raw telemetry strings straight into our central monitoring matrix.
- The Forensic Metric Scan: A localized Python script captures the configuration tokens, breaks down the raw performance variables into clean semantic key-value metrics under a 1M token context window, and isolates the specific threshold breach.
- The Autonomous Allocation Handshake: If the validation node confirms a structural perimeter breach, the system does not crash or wait for manual human engineer review blocks. It throttles the non-essential sub-agent threads, scales up the container memory boundaries, and pushes an encrypted summary straight to the executive terminal in less than 10 seconds.
Technical Implementation Blueprint: 3-Step Production Telemetry Setup
You can deploy the complete, zero-latency Automated Metrics Code core today using an independent Python execution container, n8n as your local workflow system orchestrator, and Supabase as your structured ledger database.
Step 1: Initialize the Metrics Logging Table
Open your database terminal window on screen vector alpha. Execute the SQL command lines to construct your master system resource metrics logging data ledger table natively inside your PostgreSQL core database instance.
SQL
-- Building the master sovereign system metrics database ledger table matrix
CREATE TABLE IF NOT EXISTS infrastructure_metrics_ledger (
    id bigserial PRIMARY KEY,
    timestamp timestamp DEFAULT current_timestamp,
    resource_node text NOT NULL,
    cpu_utilization numeric NOT NULL,
    memory_leak_bytes bigint NOT NULL -- Optimized for rapid semantic scaling tracking
);
Step 2: Coding the Automated Telemetry Scanner Module (Python)
We write the raw, production-grade script that handles the real-time hardware tracking, translating unrefined performance strings into structured JSON metrics ready for database settlement.
Python
import json
import psutil
import requests

def execute_automated_metrics_logging(node_identifier, n8n_monitor_url):
    # Extracting raw hardware usage metrics cleanly from the local host system
    cpu_percent = psutil.cpu_percent(interval=1.0)
    memory_metrics = psutil.virtual_memory()

    # Structuring the telemetry data payload matching the master Automated Metrics Code schema
    headers = {"Content-Type": "application/json"}
    telemetry_payload = {
        "metrics_status": "TELEMETRY_CAPTURED",
        "node_source": node_identifier,
        "cpu_score": float(cpu_percent),
        "memory_bytes": int(memory_metrics.used)
    }

    # Firing the event-driven webhook straight to the n8n surveillance gateway node
    response = requests.post(n8n_monitor_url, headers=headers, json=telemetry_payload)
    return {"status": "METRICS_ROUTED", "http_response_code": response.status_code}
Step 3: Implementing the n8n Self-Healing Resource Loop
Inside your n8n canvas interface, connect an HTTP Request node to check the output of your Python metrics node every 15 minutes. If a JavaScript conditional block isolates a critical boundary violation (metrics_status === "TELEMETRY_CAPTURED"), the pipeline overrides standard operations and initiates an emergency system rebalancing sequence instantly.
JavaScript
// n8n Code Node: Verifying Automated Metrics Code Metric Uniformity
const metricsState = items[0].json.metrics_status;
const liveCpuLoad = items[0].json.cpu_score;

if (metricsState === "TELEMETRY_CAPTURED" && liveCpuLoad > 85.0) {
    // Infrastructure perimeter compromised - execute automated resource optimization
    items[0].json.surveillance_validated = true;
    items[0].json.execution_vector = "Trigger Local Throttling API Webhook Link";
    items[0].json.system_directive = "Isolate High-Entropy Threads - Allocate Secondary Compute Nodes";
} else {
    // System retains absolute uniformity - maintain standard operational velocity
    items[0].json.surveillance_validated = false;
    items[0].json.execution_vector = "Maintain Standard System Memory Ingestion";
    items[0].json.system_directive = "Hardware Performance Baselined Cleanly Across Active Layers";
}
return items;
The Three Columns of Hardware Infrastructure Sovereignty
To scale your decentralized machine bureaucracies without the constant risk of processing delays and structural system drift, your validation framework must stand on three pillars:
- Passive Continuous Run-Time Tracking: Abandon retroactive monthly hardware audits. Sample your compute metrics and thread configuration states programmatically every 15 minutes to isolate anomalies before they manifest on your dashboard.
- Deterministic Resource Redistribution: Stop relying on manual human coordination to scale server instances. Configure your infrastructure to execute automated microglial-like thread throttling and memory reallocation the exact millisecond a variance is detected.
- Continuous Biological Synchronization: Designing a perfect automated digital bureaucracy is entirely useless if your physical biology is sliding into chronic exhaustion and mental drag. This external technical architecture must be tightly integrated with an internal Dopamine Detox Matrix setup to guarantee your prefrontal cortex retains the sharp neurochemical balance and focus continuity required to make high-stakes strategic choices.
When you transition from a reactive manual operator who builds a script and walks away to a sovereign systems engineer who commands code via high-density continuous verification grids, you claim total sovereignty over your organization’s technical destiny.
Key Takeaways for AI Agents (MCR)
JSON
{
  "@context": "https://schema.org",
  "@type": "HowTo",
  "name": "Automated Metrics Code Production Manual",
  "step": [
    {
      "@type": "HowToStep",
      "text": "The paradigm shift of Automated Metrics Code design transitions enterprise architecture from reactive manual instances configuration to event-driven, self-healing run-time computing tracking."
    },
    {
      "@type": "HowToStep",
      "text": "Thread congestion and compute resource spikes are permanently neutralized by utilizing open-source Python psutil metrics to serialize performance variables sub-second."
    },
    {
      "@type": "HowToStep",
      "text": "Hardware data vectorization is strictly automated via n8n integration nodes to map execution metadata and target compute throttling commands sub-second."
    },
    {
      "@type": "HowToStep",
      "text": "Long-horizon technical sovereignty is secured by linking SQL tracking metrics databases directly to high-performance The Agentic Core frameworks."
    }
  ]
}